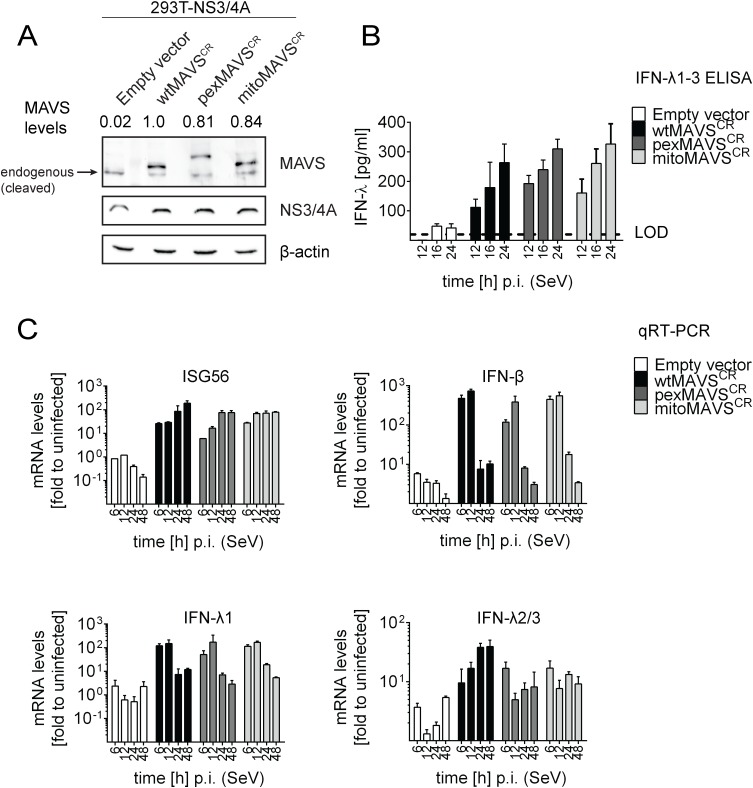
Fig 3. Comparable activation of type I and III IFN response by peroxisomal or mitochondrial MAVS upon virus infection.
(A) Lysates of 293T cells stably expressing NS3/4A and various forms of non-cleavable MAVSCR or an empty vector were analyzed by Western blot. Numbers above each lane refer to MAVS expression levels normalized to β-actin and wtMAVSCR expression that was set to one. (B) Cells were infected with Sendai virus (SeV) with an MOI of 3. The amount of IFN-λ released at given time points into the cell culture supernatant was determined by ELISA. The dashed line represents the limit of detection (LOD). (C) Cells were infected with SeV and total RNA was extracted at time points specified in the bottom of each panel. mRNA amounts were quantified by qRT-PCR. All data were normalized to GAPDH using the ΔΔct method. A representative experiment of a total of three independent experiments is shown. Each value was measured in quadruplicates; mean values and standard errors are shown.

