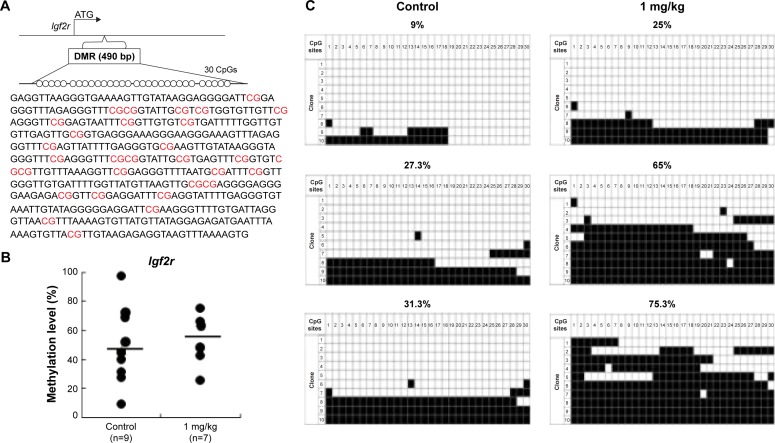
Figure 9.
Analysis of control and AgNP-exposed placentas indicated that exposure increased methylation of the Igf2r gene.
Notes: The Igf2r DMRs are depicted in (A), including the sequences analyzed in the (B) pyrosequencing and (C) bisulfite sequencing assays. (A) In total, 30 CpG sites (highlighted in red) located in a 490 bp region of the Igf2r DMR were assayed by bisulfite sequencing. The 30 CpGs were analyzed by pyrosequencing. (B) Pyrosequencing data for the control and AgNPs exposure are presented with the samples exhibiting black circles of Igf2r. The y-axis represents the percentage of total methylation. The black horizontal line in each exposure group indicates the average methylation. The sample sizes analyzed in each exposure group are indicated. (C) Three placentas from both the control and AgNP exposure groups were analyzed by bisulfite sequencing, and the methylation status of Igf2r is indicated. The CpG sites within DMRs are shown; filled squares denote methylated and open squares denote unmethylated. The percentages of methylation at all CpGs are indicated. The average CpG methylation levels are 45.5% in the control group and 52.7% in the AgNPs-treated group (P<0.01).
Abbreviations: AgNPs, silver nanoparticles; DMR, DNA methylated region.

