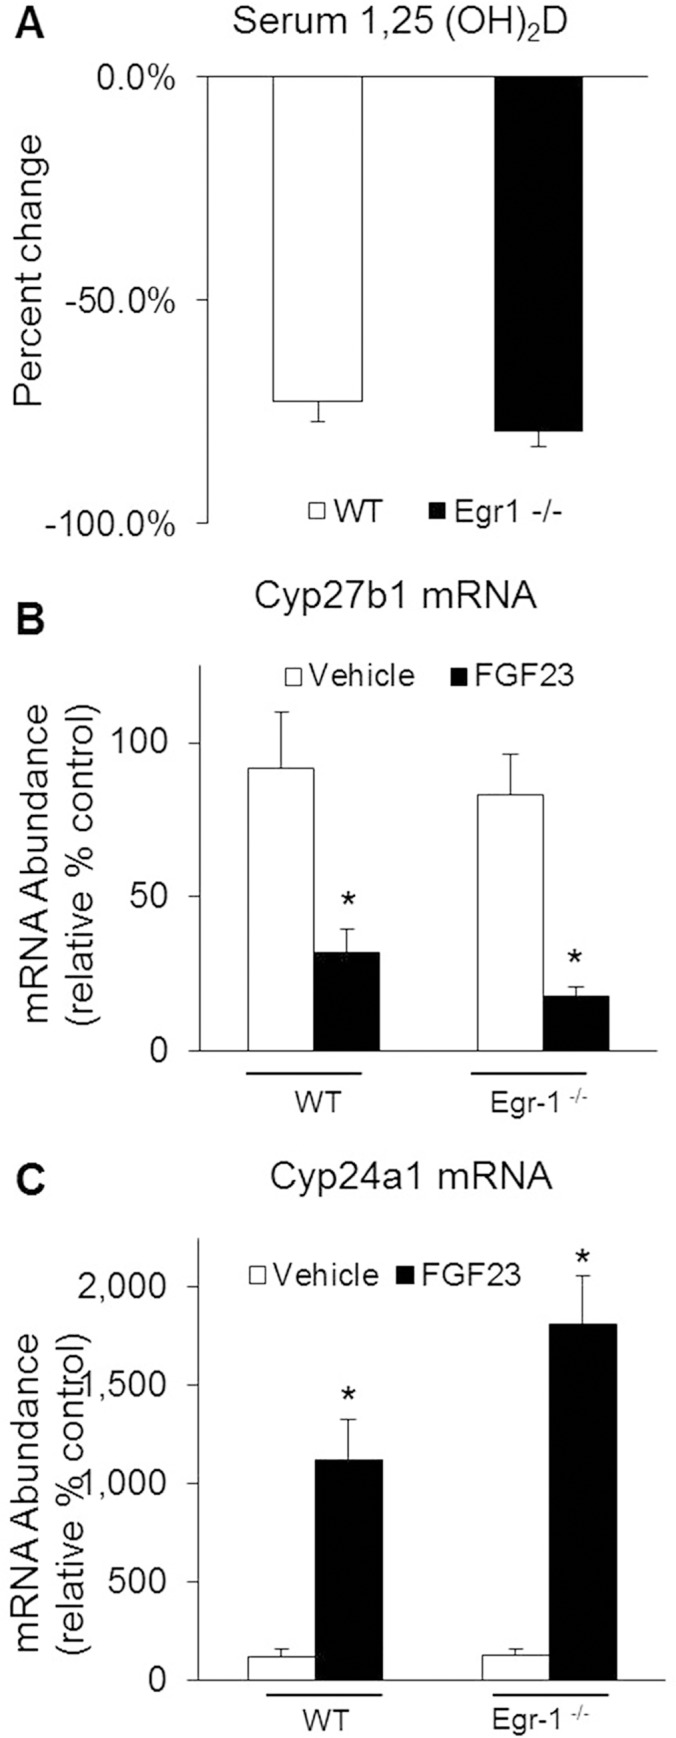
Fig 2. Effects of egr-1 gene deletion on renal 1,25(OH)2D metabolism.

Egr-1 -/- and wild-type (WT) mice were treated with vehicle or FGF23. A. Serum 1,25(OH)2D concentrations. B. Renal cyp27b1 and, C. Renal cyp24a1 mRNA abundance were quantitated by real-time PCR, normalized to that of gus mRNA, and expressed as a percent relative to vehicle-treated WT mice. Bars depict mean ± SEM (n = 8–10 mice/group) * P<0.05, compared to egr-1 -/- and WT mice treated with vehicle.
