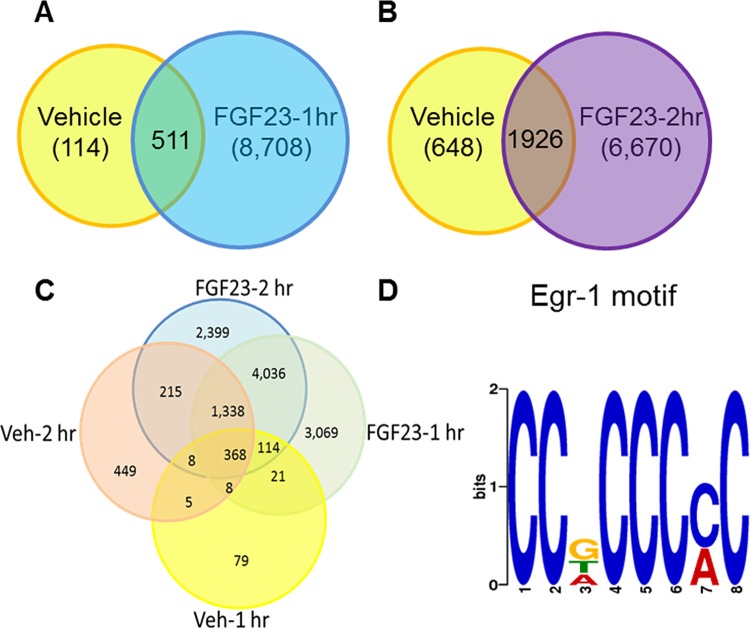
Fig 4. Schematic representation of the active regions identified by ChIP-seq analysis in normal mice kidney after treatment with FGF23 or vehicle.
A-C. Venn and Euler diagrams showing overlap of egr-1 binding sites between different treatment groups. D. Motif discovery using MEME. Consensus motif for egr-1, as determined by querying the 1,200 most enriched ChIP-seq loci.

