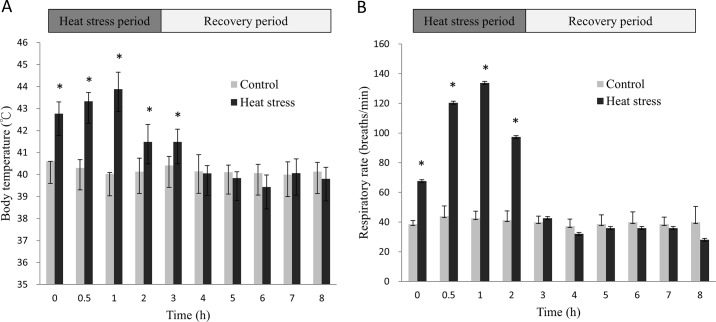
Fig 1. Body temperature (A) and respiratory rate (B) of acute-heat-stressed and control hens during stress and recovery periods.
Data are mean ± standard error (n = 12; n = 6 and n = 3 in groups with 2-h and 6-h recovery after heat stress, respectively). * Values differed between heat-stressed and control groups (p < 0.05).

