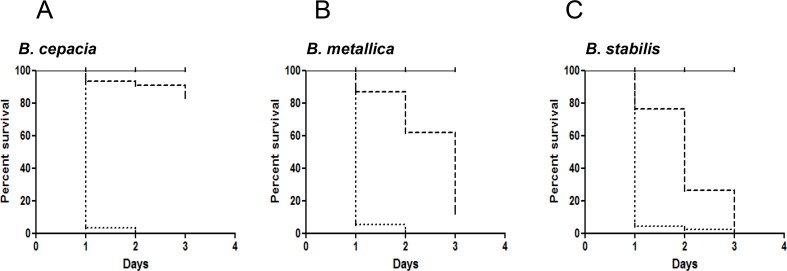
Fig 2. Kaplan-Meier survival plots for L4 stage WT worms fed with: E. coli OP50 (solid lines), Bcc strains on NGM (dashed lines), Bcc strains on PGS (dotted lines). n: Number of worms at day 0.
A) The pathogenicity of Bcc strain B. cepacia on SKA (n = 93) was compared with the ability on FKA (n = 184). B) The pathogenicity of Bcc strain B. metallica on SKA (n = 80) was compared with the ability on FKA (n = 113). C) The pathogenicity of Bcc strain B. stabilis on SKA (n = 87) was compared with the ability on FKA (n = 161). P-values were calculated between survival curves on FKA and SKA of each bacteria, and resulted to be < 0.0001 calculated with "Log-rank (Mantel-Cox) Test" with the Graph-pad Prism 5 software.

