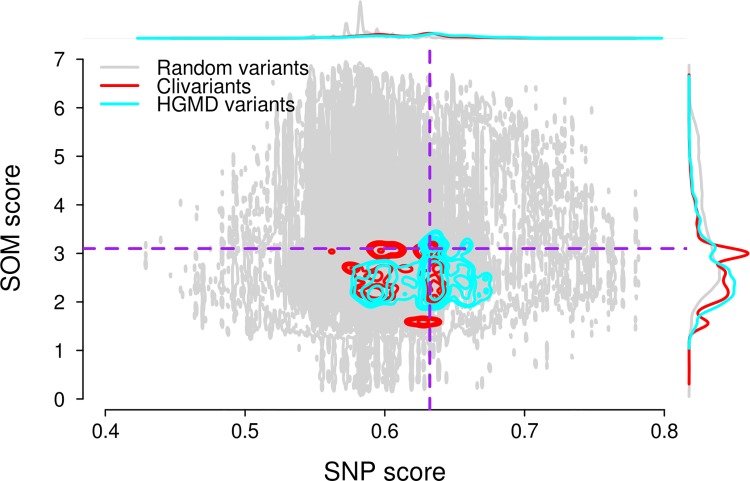
Fig 3. Relationship between SNP and SOM scores in liver cancer.
Grey dots: 1 million random genome positions; cyan contour: HGMD disease-causing variant positions; red contour: Clivariant positions. The top and right curves show marginal distributions of SNP scores (top) and SOM scores (right) for random genome positions, HGMD and Clivariant disease-causing variant positions. Dotted lines define cutoff values for hypomutated/hypermutated regions. SNP score cutoff = 0.63 (98.16Mb above cutoff), SOM score cutoffs = 3.10 variants/Mb, defining areas below cutoff of 55.67 Mb, in liver cancer. Hypomutated regions defined by both cutoff correspond to ~56Mb in liver cancer type.

