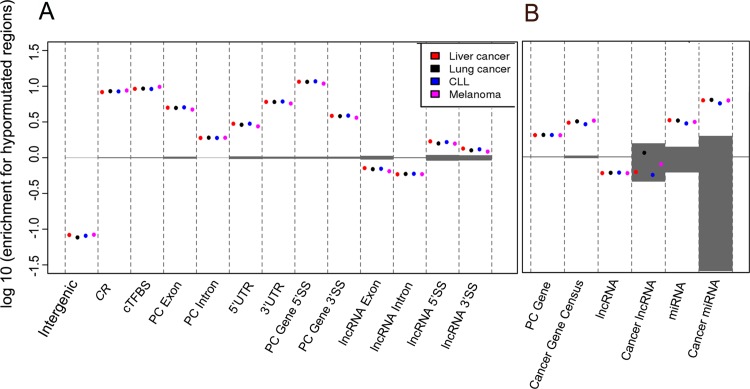
Fig 4. Enrichment for hypomutated positions within different genome features (A) and gene classes (B).
Positive values indicate enrichment, negative values indicate depletion. Hypomutated (high SNP, low SOM) positions were mapped onto genome features (A) or genes from three different classes (Protein-coding, lncRNA, miRNA) (B). For each feature or gene class, enrichment for hypomutated positions was computed as explained in Methods. As hypomutated positions are cancer-specific, different results are obtained for each cancer class (colored dots). Shaded grey areas show enrichment ranges obtained from 1000 random permutations (see Methods).

