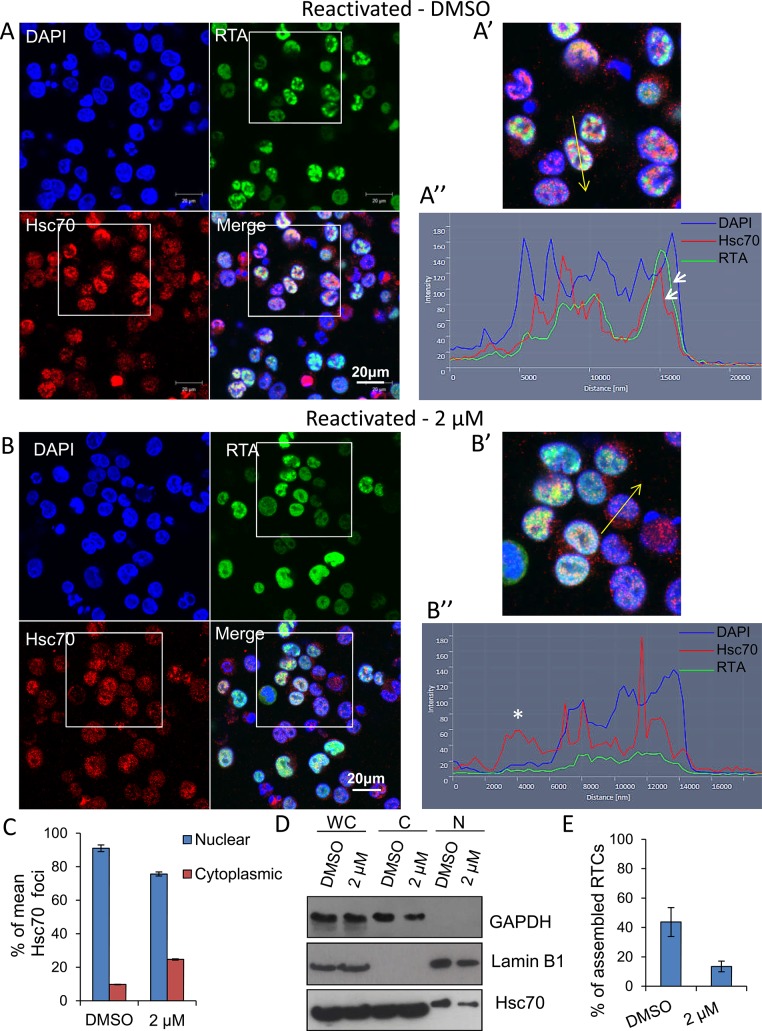
Fig 8. Inhibition of Hsp70 isoforms prevented Hsc70 chaperone recruitment to KSHV RTCs and RTC formation.
(A) TREx BCBL1-RTA cells were reactivated and treated with control DMSO (0.1%) for 24 h. Multiple KSHV RTCs identified by RTA-labelling were formed in DMSO-treated cells to which large and numerous Hsc70 foci were recruited. In these cells, Hsc70 was depleted from the cytoplasm. (A’) Confocal images were subjected to profiling analysis using Zeiss Zen 2011 software. Profiling was conducted for each cell in two representative confocal images taken with a 40-times objective; this included profiling a total of 49 DMSO-treated cells. A representative line profile (yellow line) and accompanying relative intensities of each channel at every pixel along the line is shown for a DMSO-treated reactivated cell. The DAPI intensity profile shows values below 25 outside the nucleus boundary. RTA profile shows a peak with intensity of 160 that lies within the DAPI boundaries corresponding to a KSHV replication compartment. Hsc70 peaks lie within the DAPI boundaries demonstrating their nuclear location. An Hsc70 intensity peak closely resembles the RTA intensity peak (arrows), indicating co-localization of Hsc70 with RTA since both peaks occur at the same position along the line. (B) In cells reactivated and treated with 2 μM VER-155008 for 24 h, RTA was diffuse in the nucleus and not assembled into KSHV RTCs. In addition, Hsc70 nuclear foci were smaller and less abundant than in DMSO-treated cells and Hsc70 was not depleted from the cytoplasm. (B’). Confocal profiling was performed for each cell in two representative confocal images taken with a 40-times objective; a total of 68 inhibitor-treated cells were analysed. A representative line profile (yellow line) is shown for an inhibitor-treated cell. An Hsc70 peak is seen outside the DAPI boundaries corresponding to an Hsc70 cytoplasmic peak (asterisk). (C) Total Hsc70 peaks and total nuclear Hsc70 peaks per cell were combined for each confocal image and experimental condition. Data was converted to percentage of nuclear and cytoplasmic peaks. From this mean percentage, standard error of the mean was calculated. (D) Reactivated TREx BCBL1-RTA cells for 24 h in the presence or absence of 2 μM VER-155008 were fractionated into whole cell (WC), cytoplasmic (C) and nuclear (N) fractions. Equal amounts of total protein from each fraction were analysed by Western blotting. A slight increase in cytoplasmic Hsc70 which correlated with a small decrease in nuclear Hsc70 was detected in inhibitor-treated cells. (E) The percentage of assembled RTCs in the presence and absence of 2 μM VER-155008 for 24 h was calculated by counting all the cells and corresponding assembled RTCs present in six representative confocal images taken with a 40-times objective. A total of 227 cells were counted in DMSO-treated cells and a total of 260 cells in inhibitor-treated cells. DMSO-treated cells had ~ 44% assembled RTCs, in contrast, in the presence of VER-155008, only ~ 13% of the cells presented well-developed RTCs.

