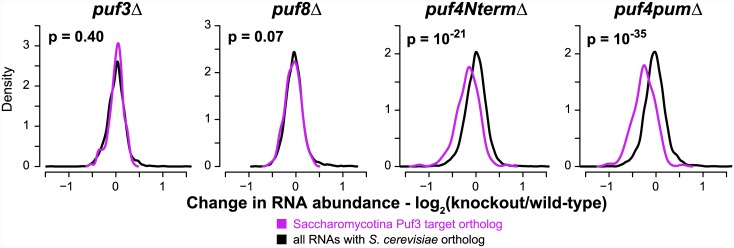
Fig 7. Gene expression profiling of Puf mutants in N. crassa.
Density plots displaying changes in RNA abundance for orthologs of Saccharomycotina Puf3 targets (purple) or orthologs of any S. cerevisiae protein (black). The p-values were computed using the two-sided Wilcoxon test. Note that the partial gene knockouts of Puf4 each exhibited a significant growth defect of ~5% relative to a wild-type strain, signifying a functional defect despite part of the gene remaining in each strain (S13 Fig, S7 Table). Gene expression data can be found in S10 Table.

