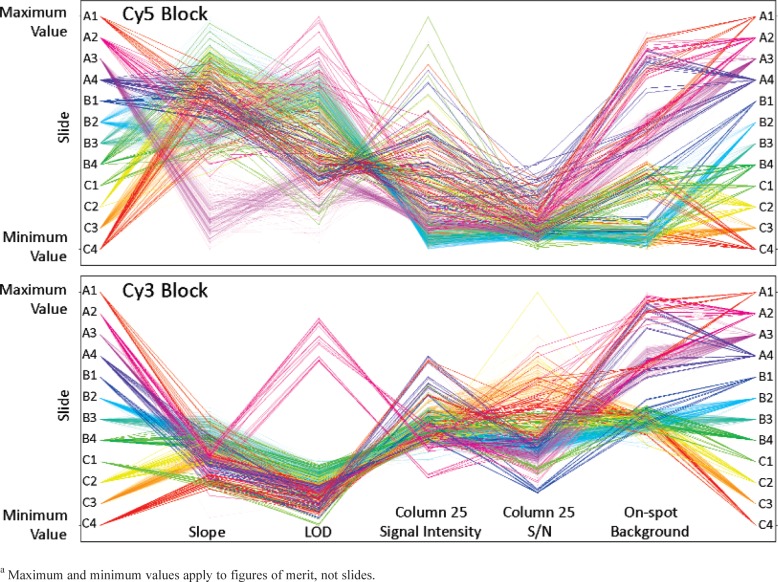
Fig. 9.
Figures of merit of all 12 slides for all scans taken on Scanner R during the five week study. Each slide is represented by a different color with a single line representing each scan, thus the heavy use slides have 135 lines, the standard use slides have 15 lines and the minimal use slides have 6 lines. The lines represent each scan and are used to visually indicate each data point for each figure of merit. Each figure of merit is normalized so the range shown is the range of values exhibited by the figures of merit in the study for both Cy5 and Cy3 dye blocks.

