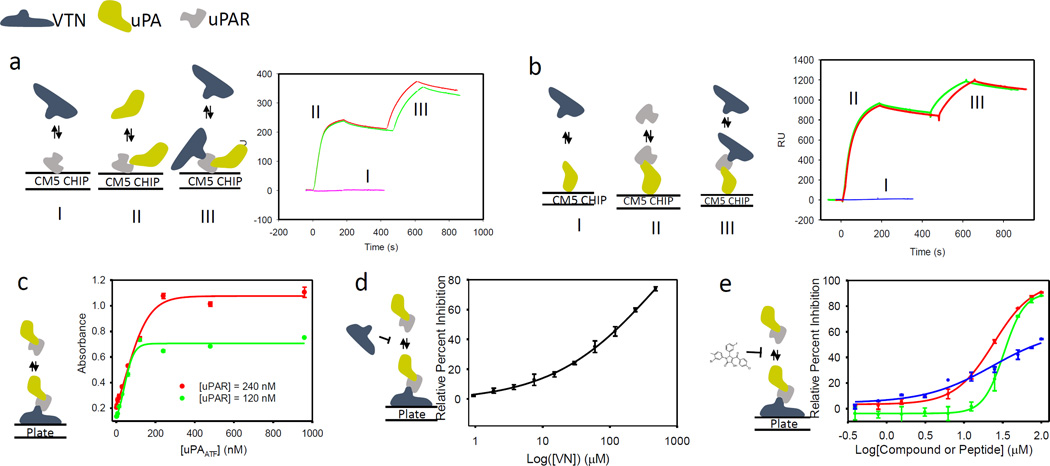
Figure 3.
(a) Direct binding assay using surface plasmon resonance with uPAR immobilized on the surface of the CM5 chip. First, VTN is injected onto uPAR as illustrated by the schematic and the curve labeled I; then uPAATF is injected as illustrated by the schematic and curve labeled II; this is followed by injection of VTN as illustrated by schematic and curves labeled III. The injection of uPAATF and VTN is carried out in duplicate as illustrated by the red and green curves. (b) Direct binding assay using surface plasmon resonance with uPAATF immobilized on the surface of the CM5 chip. First, VTN is injected onto uPAATF as illustrated by the schematic and the curve labeled I; then uPAR is injected as illustrated by the schematic and curve labeled II; this is followed by injection of VTN as illustrated by schematic and curves labeled III. The injection of uPAR and VTN is carried out in duplicate as illustrated by the red and green curves. (c) An ELISA was used to measure binding of uPAR to VTN in the presence of serial dilutions of uPAATF. Data are shown as mean +/− S.D. (n = 2). (d) An ELISA was used to measure inhibition of uPAR•uPAATF binding to VTN coated microtiter plate by serial dilutions of VTN. (c) An ELISA was used to measure inhibition of uPAR•uPAATF binding to VTN coated microtiter plate by serial dilutions of compounds or peptides. Data are shown as mean +/− S.D. (n = 2).

