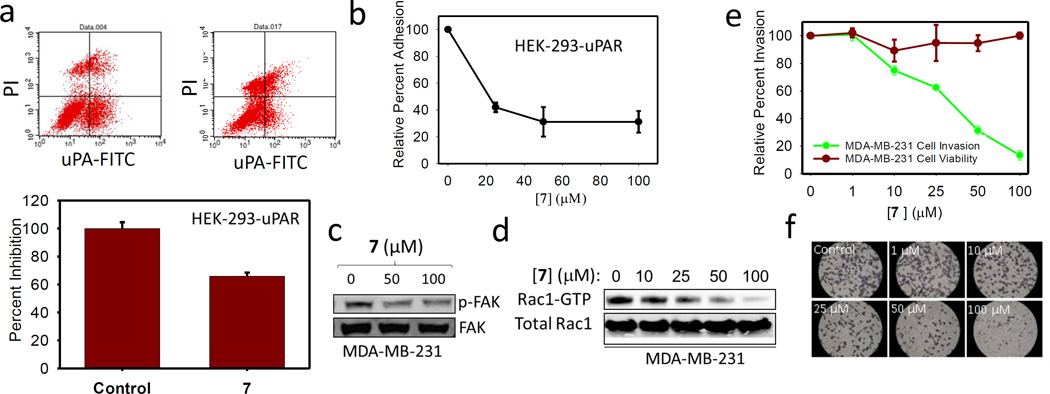
Figure 4.
(a) Flow cytometry analysis using FITC-conjugated HMW-uPA and PI staining. 100 µM of 7 and control analyzed for uPAR•uPA binding. (b) Effects of 7 on HEK-293-uPAR adhesion to VTN; data are shown as mean +/− S.D. (n = 3). (c) Immunoblot showing the expression levels of FAK, p-FAK in MDA-MB-231 cell lines. (d) GST-Rac1 pull-down assay. The protein complexes were subjected to immunoblot analysis to detect active Rac1. Rac1 from total cell lysates was used as a control. (e) Cell invasion studies with the Boyden Matrigel Invasion Chamber and MTT assay to characterize the role of 7 in cell proliferation and cell Invasion; data are shown as mean +/− S.D. (n = 3). (f) Representative experimental cells from control and in the presence of 7 were photographed (×400) to illustrate the effect of 7 on invasion.

