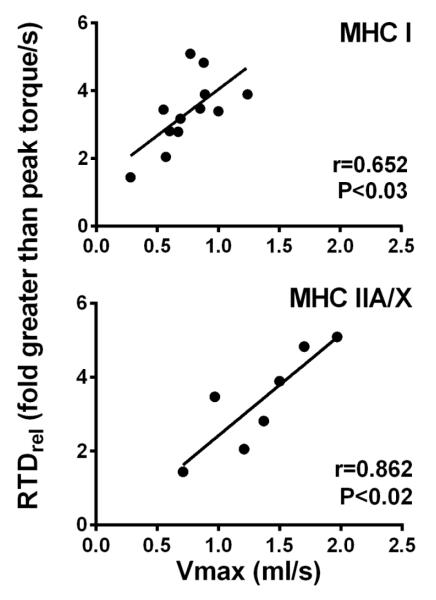
Figure 2.
Relationship of RTDrel to shortening velocity (Vmax) in MHC I (n=12) and IIA/X (n=7) fibers in knee OA volunteers. Note that variation in sample size is related to the fact that not all volunteers had fibers of a specific fiber type analyzed due to simple random variation in the fibers that were selected for analysis (ie, fiber type is blinded until after analysis, when MHC isoform is determined) and because data from one male knee OA volunteer was removed because his average data were outliers for MHC IIA and IIA/X fibers (detailed in Methods).

