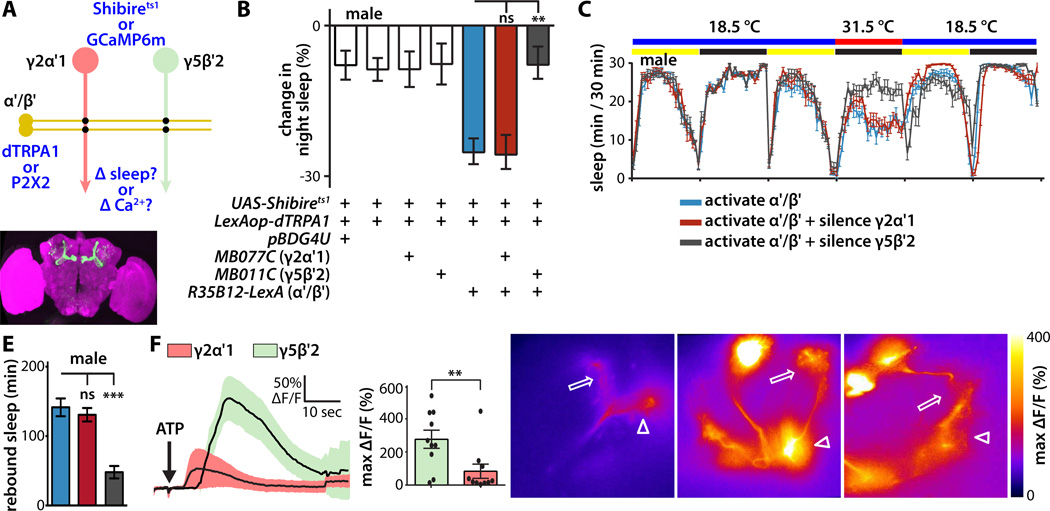
Figure 3. Segregated synaptic information flow from wake-promoting KCs to wake-promoting MBONs.
(A) Schematic of experimental design to probe synaptic connections between wake-promoting α'/β' KCs and sleep-regulating MBONs in male flies. For behavioral genetic experiments, dTRPA1 was expressed in α'/β' KCs using the R35B12-LexA driver, and Shibirets temperature-gated silencer of synaptic release in MBONs using split-GAL4. For physiological experiments, P2X2 ATP-gated depolarizing cation channel was expressed in α'/β' KCs, and GCaMP6m fluorescent Ca 2+ indicator in MBONs.
(B) Change in night sleep compared to the previous night of male flies bearing the indicated transgenes after temperature shift from 18.5°C to 31.5°C to simultaneously activate dTRPA1 and Shibirets1. Synaptic silencing of wake-promoting MBON-γ5β′ 2a/β′ 2mp/β′ 2mp_bilateral, but not sleep-promoting MBON-γ2α'1, prevented the wake-promoting effect of temperature-induced activation of α'/β' KCs. Statistical comparisons between indicated groups were by one-way ANOVA with Dunnett's paired-comparison test (n=48–62 flies per genotype).
(C) Sleep profiles of male flies expressing dTRPA1 in α'/β' KCs and Shibirets1 in the indicated MBONs. Flies were maintained in LD conditions, and the temperature was increased during the second night of the experiment.
(D) Whole brain of fly expressing GFP under the control of the R35B12-LexA driver, immunostained for GFP (green) and the synaptic neuropil marker BRUCHPILOT (magenta).
(E) Quantification of sleep regained during the 12 hr recovery after combined thermogenetic activation/silencing in the experiment shown in (B, C). The quantity of rebound sleep is defined as the difference in sleep amount between the 12 hr recovery period and the previous baseline 12 hr light period. Genotypes are color coded as in (B, C); statistical analysis was by one-way ANOVA and Dunnett's paired-comparison test (n = 25–32 flies per genotype).
(F) Ca2+ responses of GCaMP6m-expressing MBON-γ5β′2a/β′2mp/β′2mp_bilateral or MBON-γ2α'1 following ATP-mediated activation of P2X2-expressing α'/β' KCs. Line graph depicts ΔF/F time course (mean±sem); bar graph depicts peak ΔF/F (mean±sem). MBON-γ5β′2a/β′2mp/β′2mp_bilateral responded much more strongly to α'/β' KC activation than MBON-γ2α'1. Statistical comparison of peak responses was by unpaired t-test (n=10 brains per genotype).
(G) Heat map showing peak Ca2+ responses of representative GCaMP6m-expressing MBON-γ2α'1, MBON-γ5β'2a, or MBON-β'2mp in response to α'/β' KC activation. Arrowheads indicate MBON dendrites, arrows indicate axon terminals, and asterisks indicate cell bodies. Panel width is 80µm.

