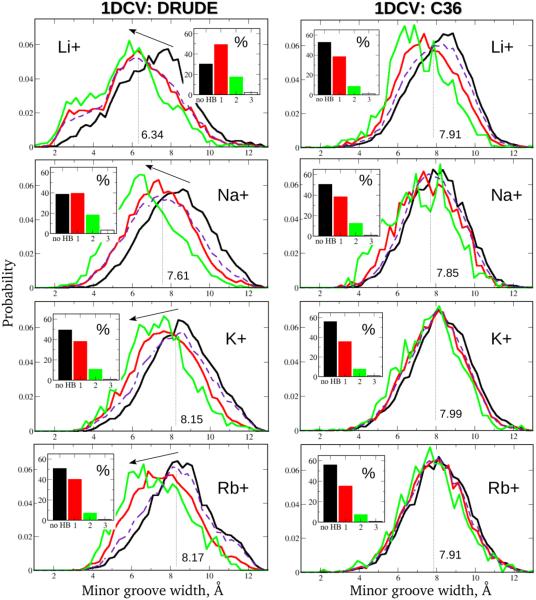
Figure 3.
Relationship between the number of the SIS–HBB complexes formed along the 1DCV oligomer and the size of the minor groove. Results for the LiCl, NaCl, KCl and RbCl salt buffers with the Drude polarizable (left) and C36 additive (right) models are shown. Red and green curves denote minor groove width probability distributions corresponding to occurrences of one and two SIS–HBB complexes, respectively, are formed; black curves indicate the distributions in the absence of SIS–HBBs; dashed purple curves and the values represent the minor groove width distributions and the corresponding averages inferred from the entire MD trajectories. Insets show the time fractions of various binding events. Arrows are placed to emphasize the effect of the increase in the number of the SIS–HBB complexes formed on the minor groove size.

