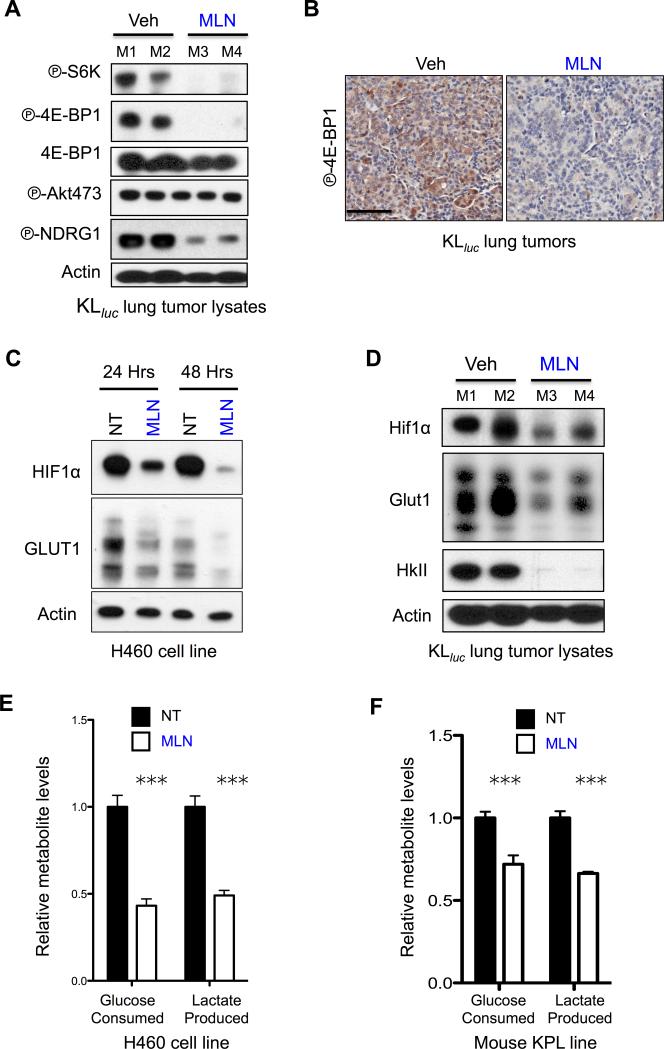
Figure 3. MLN0128 inhibited glucose metabolism in KRAS/LKB1 mutant NSCLC in vitro and in vivo.
(A) Lung tumor lysates from tumors isolated from KLluc mice (M1, M2, M3 or M4) that were treated with vehicle (Veh) or MLN0128 (MLN) for five days were probed with indicated antibodies. (B) IHC staining of P-4E-BP1 in KLluc lung tumors following five days MLN0128 treatment. Scale bars (black) = 50μM. (C) H460 cell line was treated with vehicle (NT) or 2μM MLN128 (MLN) for 24hr or 48hr. Lysates were probed with indicated antibodies. (D) Lung tumor lysates from tumors isolated from KLluc mice (M1, M2, M3 or M4) that were treated with vehicle (Veh) or MLN0128 (MLN) for 5 days were probed with indicated antibodies. (E and F) Relative levels of glucose consumption and lactate production in H460 cells (E) or lung tumor cell line derived from a KrasG12D;p53−/−;Lkb1−/− (KPL) mouse that were treated with vehicle (NT) or 2μM MLN0128 (MLN) for 24 hours. Statistical significance (p-values: * < 0.05; ** < 0.01; *** < 0.001;) calculated using a non-parametric one-way ANOVA (Tukey test). The data are represented as the mean ± SEM. Error bars represent the ± S.E.M.

