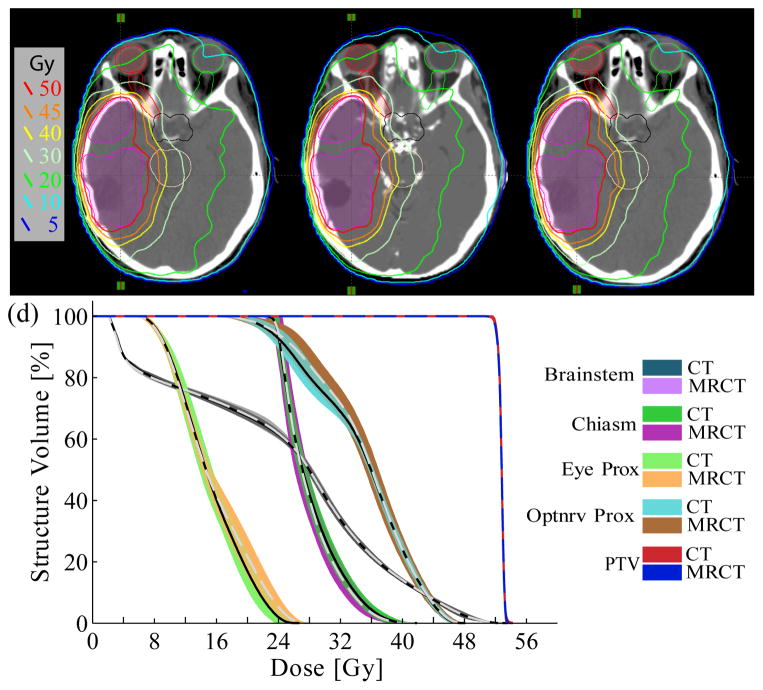
Figure 1.
Dose comparison of a single optimized VMAT plan calculated using (a) the CT, (b) the MRCT, and (c) the tMRCT (MRCT fluence on CT image) for patient #7. (c) The spread of DVH curves from ten optimizations on CT and MRCT. Solid lines represent mean DVH values from CT, dashed lines mean values from MRCT.

