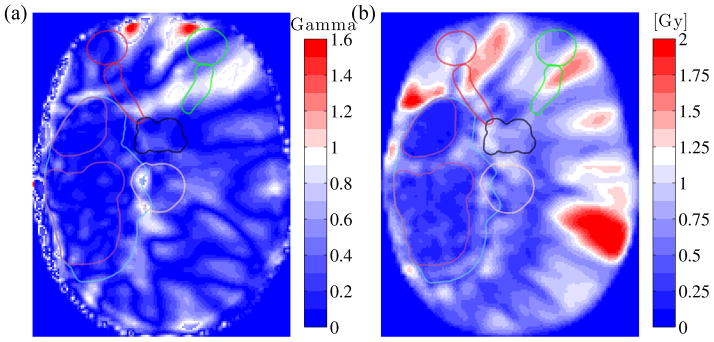
Figure 4.
(a) Gamma analysis comparing mean tMRCT vs. mean MRCT dose in the transverse plane, for patient #7. A gamma value below 1 corresponds to acceptance under the 1% / 1 mm criterion. (b) Transverse standard deviation map from the 10 MRCT VMAT plans. Structure contours are overlaid for reference.

