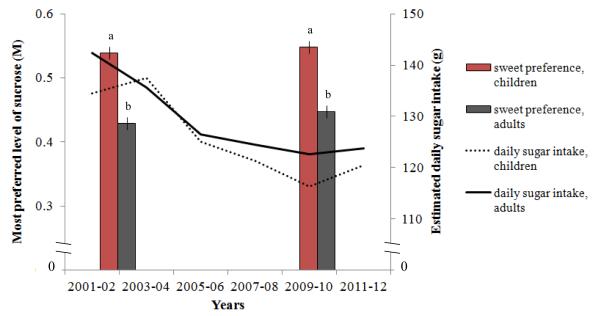
Figure 1.
Most preferred level of sucrose was collected at two time points (2002-3, 2010) in two separate populations of children (red bars) and adults (gray bars) living in Philadelphia, PA. Estimated daily sugar intake for children (2-11 years, dotted line) and adults (20-59 years, solid line) was derived from NHANES dietary recall data collected during two-year intervals from 2001-2012 (see text for references). There was a main effect of age group (F(1,650)=18.97, p<0.001) but no main effect of time period (F(1,650)=0.65, p=0.42) on level of sweet most preferred. Different letters indicate significant differences between groups.

