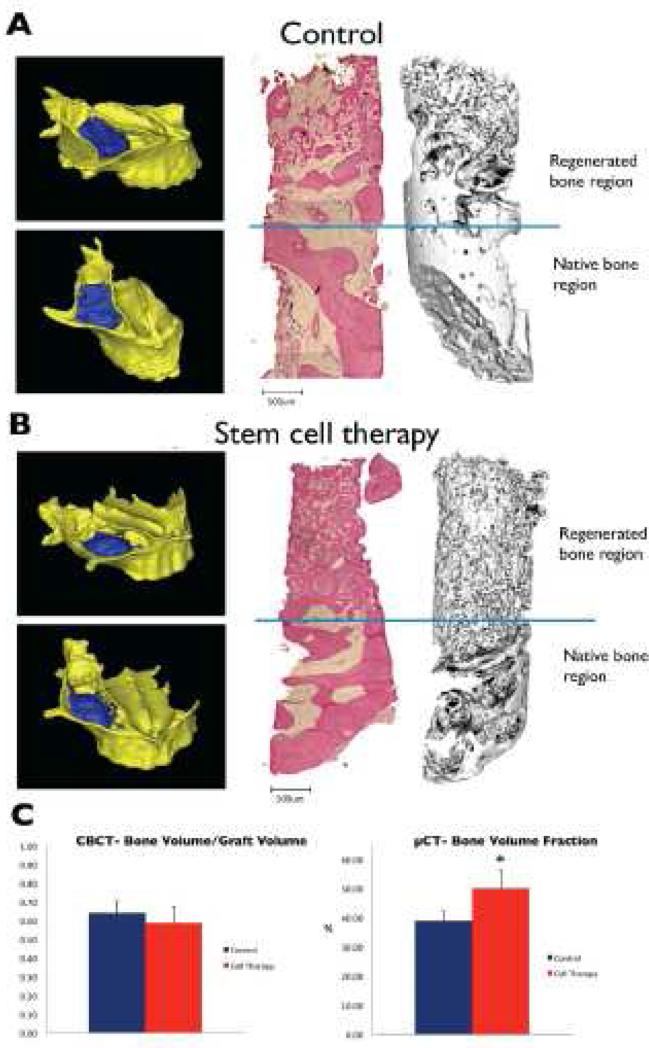
Figure 6.
Representative images of 3-D reconstructions of occlusal and lateral open views into the maxillary sinus cavity of the skull show the bone volume which was grafted (blue) in the (A) control and (B) stem cell therapy groups in severe bone defects. Histological and corresponding micro-CT images of bone biopsies harvested from the grafted regions of the two groups show a greater degree of mineralized bone tissue in the stem cell therapy group. (C) CBCT analysis of the bone volume:graft volume ratio was no different between the control and stem cell therapy groups in treating severe defects; micro-CT analyses of the bone biopsies revealed that compared to the control, Bone Volume Fraction was significantly higher in the stem cell therapy group in treating severe defects. (Reproduced with permission: [95])

