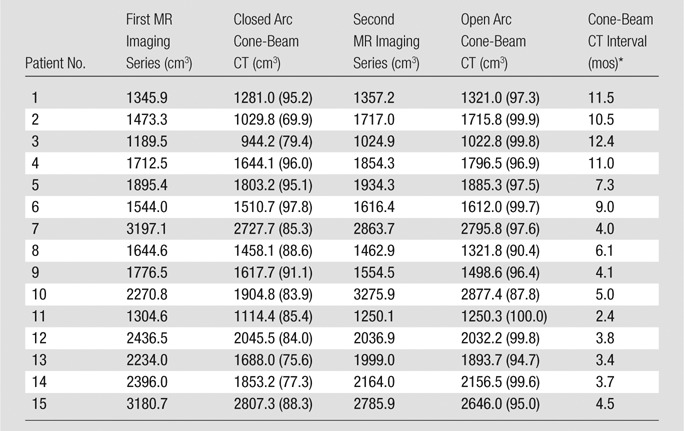
Table 2.
Liver Volumes as Measured on Cone-Beam CT Images and the Corresponding MR Images

Note.—Except where indicated otherwise, data are liver volumes, and numbers in parentheses are the percentage of liver coverage of cone-beam CT, calculated by dividing the liver volume on cone-beam CT images by the liver volume on the corresponding MR images and multiplying by 100%.
*Data are the intervals between cone-beam CT acquisitions.
