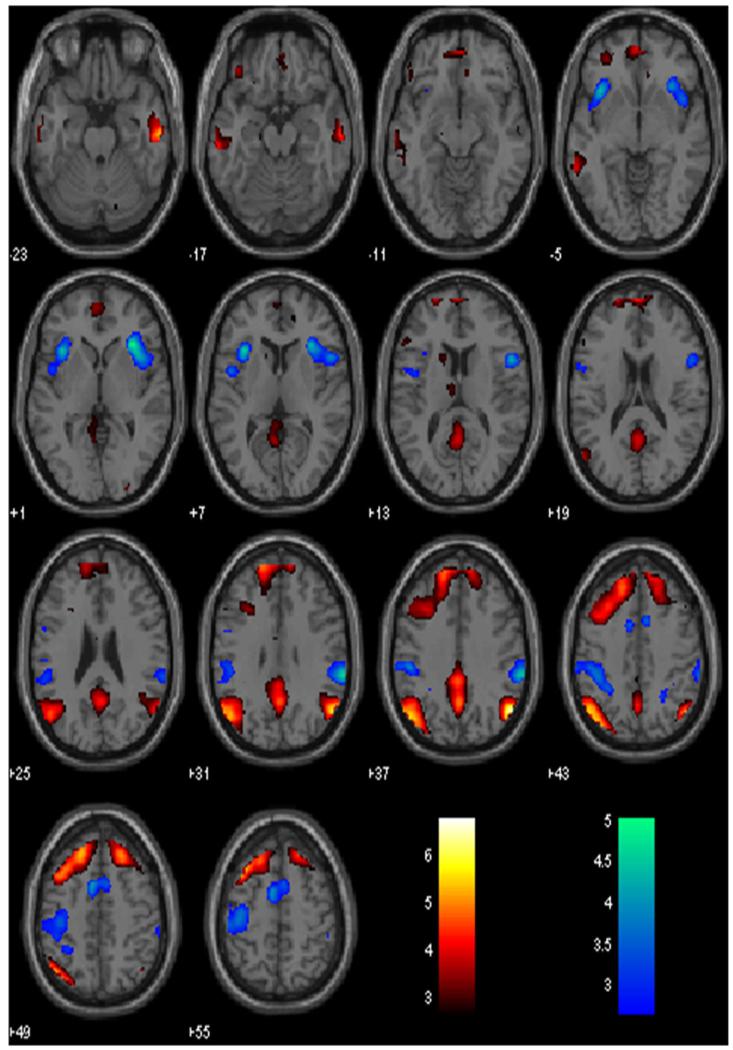
Fig. 1.
Neural correlates of speeded versus delayed motor responses in the stop signal task. Hot color shows increased activity during risk-taking responses (RT speeding > RT slowing) and winter color shows increased activity during risk-averting responses (RT slowing > RT speeding). BOLD contrasts were overlaid on a structural template in axial sections. Color bars indicate voxel T values

