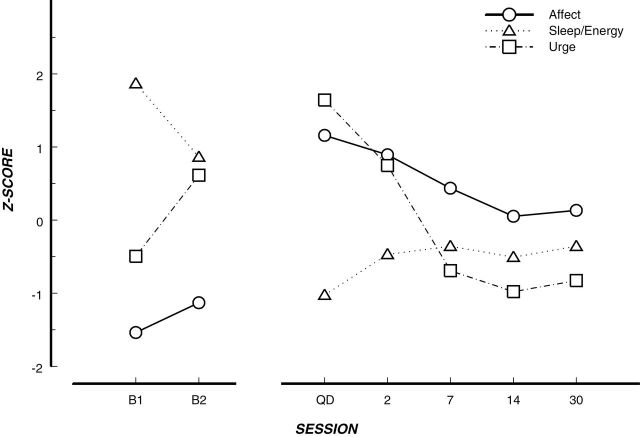
Figure 2.
Variable withdrawal symptom trajectory.30 Note. Aggregate time course of the individual symptom measures used in this article. Data points represent mean ratings from the whole sample for each factor score at the corresponding time point. Profiles are depicted in Z-score space to eliminate differences in scaling. B1 = 8 days precessation; B2 = 4 days precessation; QD = quit day. Remaining axis labels represent the number of days postquit.

