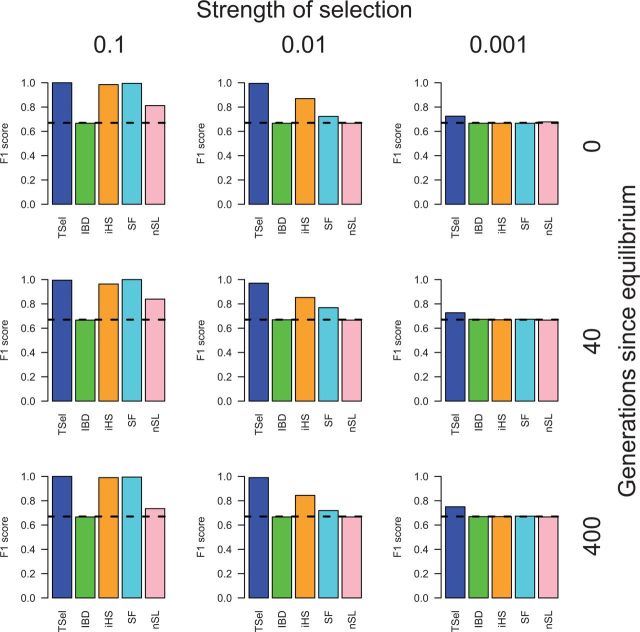
Fig. 1.
TSel performance on complete hard sweeps with an effective population size of 10,000. Performance is demonstrated through the maximum F1-score, the harmonic mean of the precision and recall score. The x axis of the grid corresponds to the strength of selection and the y axis corresponds to the time of sweep completion. The dashed, black line indicates the maximum F1-score when predicted calls are randomly assigned.

