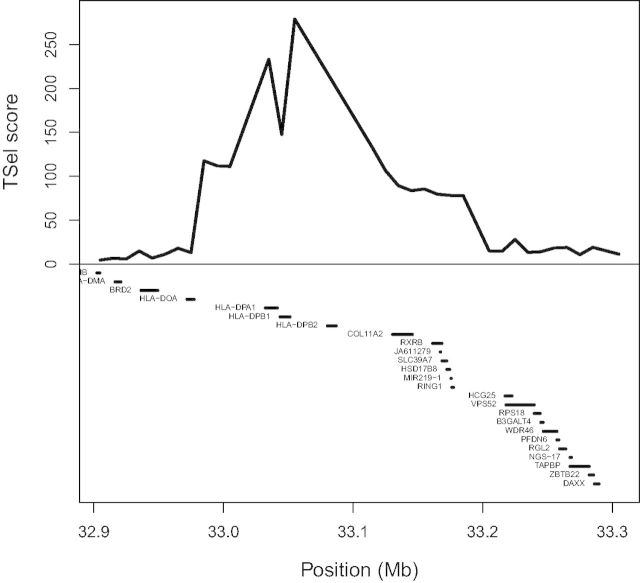
Fig. 7.
TSel replicates positive selection inference. The figure displays part of the HLA region on chromosome 6. The top of the figure shows the median TSel score over each consecutive 10-kb window. The bottom of the figure shows genes that lie within the window. Grossman and colleagues used the method CMS to infer positive selection around the genes HLA-DPA1, HLA-DPB1, HLA-DPB2, a region that is also among the top 1% of TSel scoring regions (Grossman et al. 2013).

