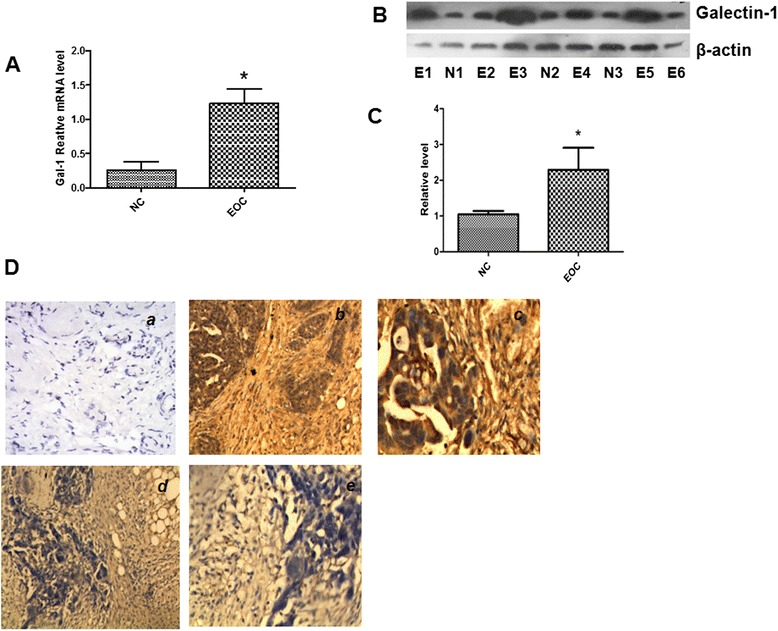
Fig. 3.

Representative results of galectin-1 expression in the tissue specimens. a QRT-PCR shows changes in the expression levels of galectin-1 in EOC cancerous tissue and normal ovary sample. b Western blotting shows changes in the expression levels of galectin-1 in EOC cancerous tissue and normal ovary samples. c Histogram of relative changes in the expression level of galectin-1 protein in the tumor and normal tissues as determined by densitometric analysis. d The typical examples of galectin-1 expression in human EOC determined by immunohistochemistry: (a) Negative galectin-1 expression in normal ovary tissue (×200). b, c Strong galectin-1 expression in EOC cells and cancer-associated stroma [×200 for (b) and ×400 for (c)]. d, e Negative galectin-1 expression in cancer cells but strong galectin-1 expression in cancer associated stroma [×200 for (d) and ×400 for (e)]. *P < 0.05. EOC: epithelial ovarian cancer; galectin-1:galectin-1; E: EOC cancerous tissue; N: normal ovary sample; NC: Negative control
