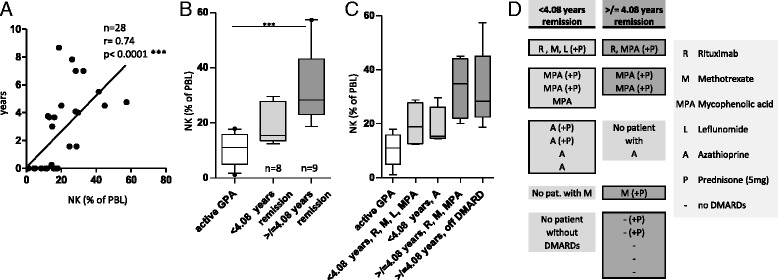
Fig. 3.

Natural killer (NK) cell proportions correlate with duration of remission. NK cell proportions of peripheral blood lymphocytes (PBLs) were determined by flow cytometry as described in Fig. 2. a Scatterplot showing the relationship between NK cell proportion and the duration of remission (in years). Spearman’s correlation coefficient (r) and statistical significance are as indicated above the graph. b Box-and-whisker plot showing NK cell proportions of inactive patients with GPA with <4.08 years of remission (n = 8) and ≥4.08 years of remission (n = 9). Statistical significance was determined by Kruskal-Wallis test (p = 0.0003) and Dunn’s multiple comparisons posttests (asterisks indicate statistical significance). c Reconfiguration of scatterplot shown in (b) after subgrouping according to disease-modifying antirheumatic drug (DMARD) therapy. d Overview of immunosuppressive maintenance/DMARD therapy. Left column, patients with <4.08 years of remission. Right column, patients with ≥4.08 years of remission. Each row of each column represents a single patient
