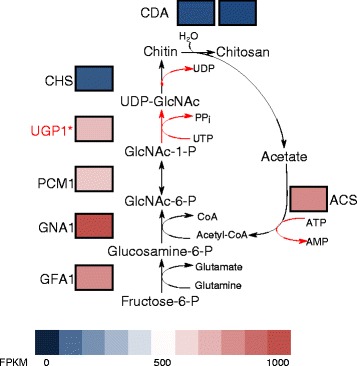
Fig. 4.

A drive for UDP-N-acetylglucosamine biosynthesis with low-level spore wall production. The heatmap shows the levels of expression of genes within the chitin biosynthesis pathway, with blue representing low levels of expression and red as high. GFA1, glutamine-fructose-6-phosphate aminotransferase; GNA1, glucosamine-6-phosphate N-acetyltransferase 1; UGP1, UDP-N-acetylglucosamine pyrophosphorylase; PCM, phosphoacetylglucosamine mutase; CHS, chitin synthase; CDA, chitin deacetylase; ACS, acetyl-CoA synthetase. The significantly lower expression levels of chitin synthases compared to the rest of the pathway leading to UDP-N-acetylglucosamine production suggest that chitin synthesis is not very active in this sample, consistent with the low expression of other enzymes involved in spore wall formation
