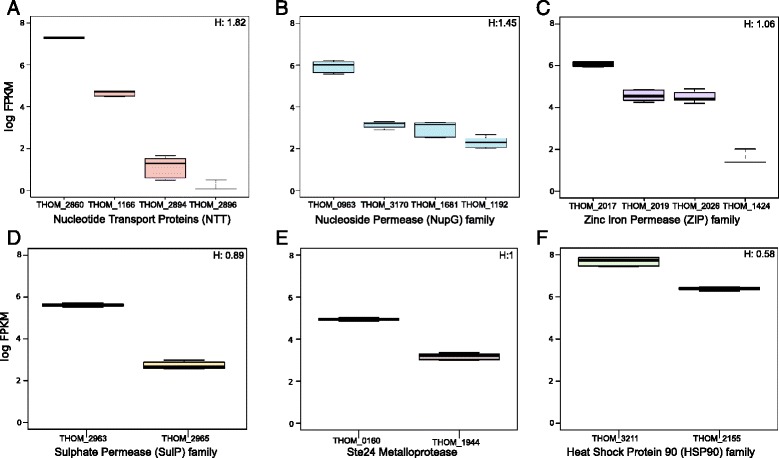
Fig. 6.

Members of gene families with evidence of sequence divergence also show variable levels of gene expression. Expression levels (log10 FPKM) for the members of gene families in which functional divergence was previously detected at the sequence level [11]. In each case, the most highly expressed paralogue is also the most highly conserved based on single gene trees. H, the heterogeneity index calculated for each gene family, is also shown (see Materials and Methods). a Nucleotide transport proteins (NTTs). b NupG-related nucleoside permeases. c Zinc iron permase (Zip) family. d Sulphate permease (SulP) family. e Ste24 metalloprotease family. f Heat shock protein 90 (HSP90) family
