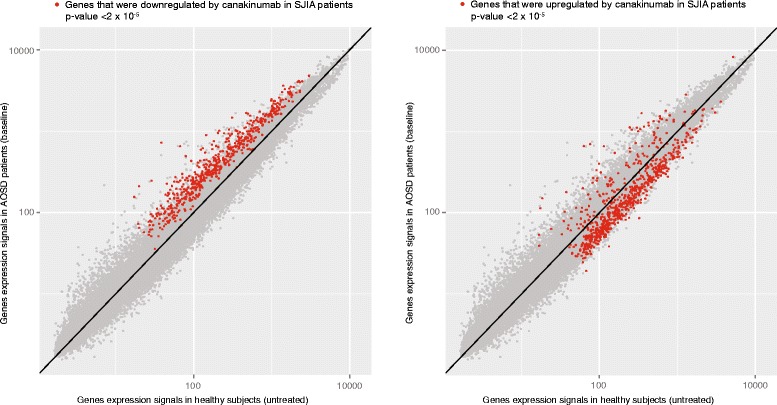
Fig. 1.

Comparison of gene-expression data for patients with AOSD prior to canakinumab treatment and healthy subjects. Dots show expression levels of individual genes where the average value in healthy subjects is shown on x axis and the average value in patients with AOSD is shown on y axis. Genes represented in red are those previously found to respond to canakinumab treatment in patients with SJIA. Genes downregulated by canakinumab in patients with SJIA were upregulated in untreated patients with AOSD, relative to healthy subjects (plot on left). Correspondingly, most genes previously found to be upregulated by canakinumab in SJIA were downregulated in untreated patients with AOSD (plot on right). P values refer to significance of differential expression of canakinumab gene sets
