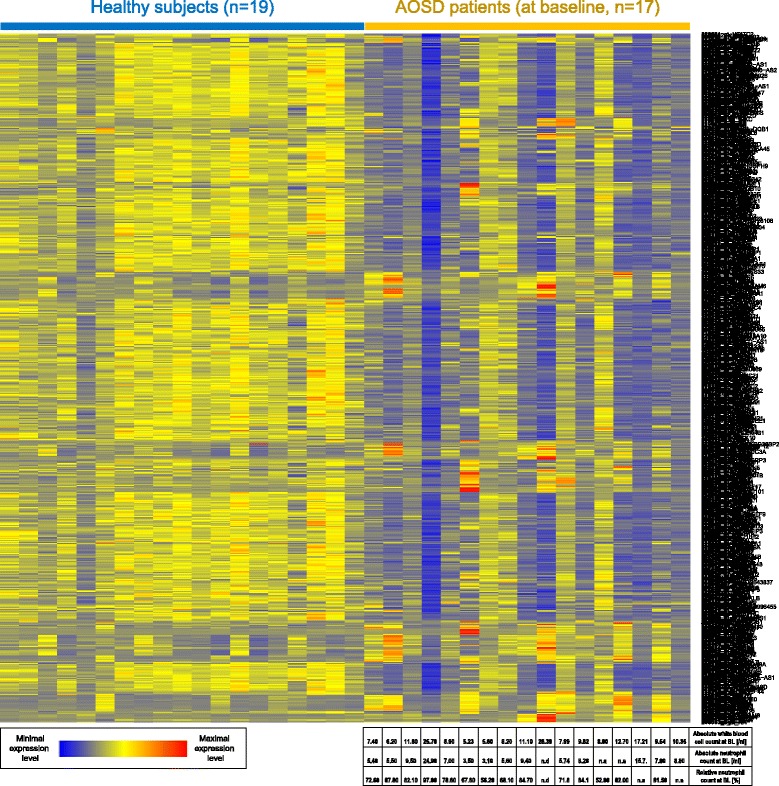
Fig. 3.

Color-coded expression values of genes up regulated following canakinumab treatment in patients with SJIA. Gene-expression values are shown for healthy subjects and patients with AOSD prior to canakinumab treatment. Transcripts shown in rows and patient samples in columns. For patients with AOSD, baseline (BL) blood cell counts are also provided (bottom)
