
Fig. 4.
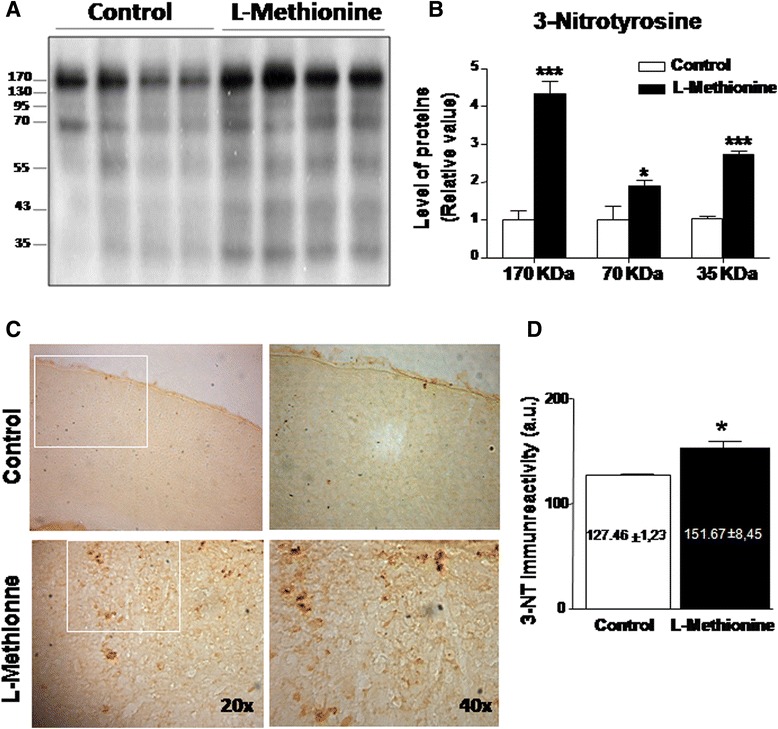
Proteins with 3-nitrotyrosylation are increased in L-methionine cortex and hippocampus samples. a Western blot of hippocampus lysates using 3-NT antibody. b Densitometric analysis of proteins at 170, 70 and 35 kDa, respectively. c Histological slices were treated to evaluate 3-nitrotyrosylation levels. The upper photographs show the control cortex, and the lower photographs show the L-methionine cortex at 20x and 40x. d Quantification of the photographs (n ≥ 4). Bars are mean ± SEM. *P < 0.05, **P < 0.01, ***P < 0.001