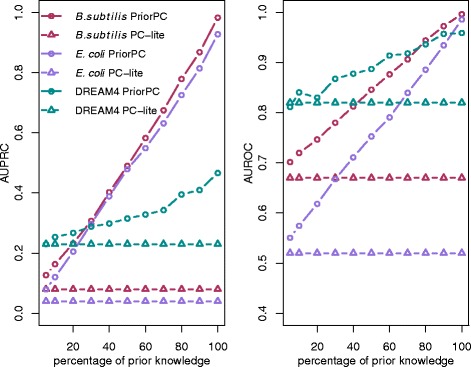
Fig. 2.

Performance of PriorPC against the percentage of edges with a prior. The left subplot shows the AUPRC, while the right subplot shows the AUROC. PC-lite is plotted with triangles, while PriorPC is plotted with circles. The different colors represent the different datasets. PriorPC outperforms PC-lite and its performance increases with the percentage of edges with a true prior
