
Fig. 2.
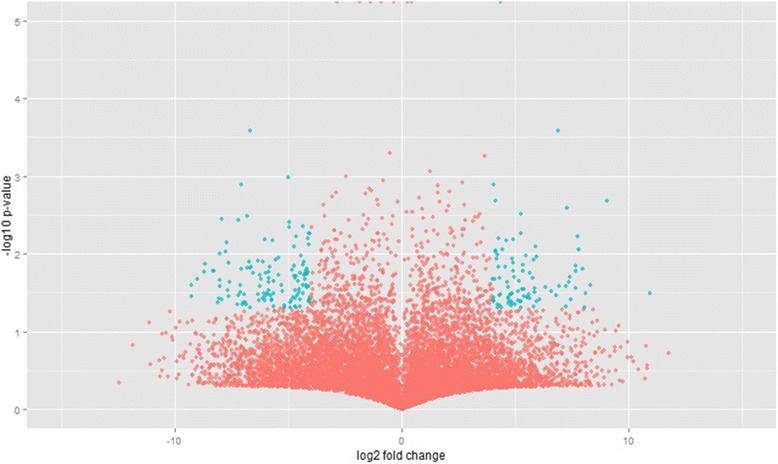
Distribution of the transcripts of the S. frugiperda transcriptome based on the comparative analysis of the gene expression of susceptible (LUF-S) and lufenuron-resistant (LUF-R) strains, induced or non-induced by lufenuron. Marked in green are the transcripts with a significant difference in the expression level, based on the discriminative significance values (t-test, p < 0.05) and relative expression (>4) adopted here