
Fig. 6.
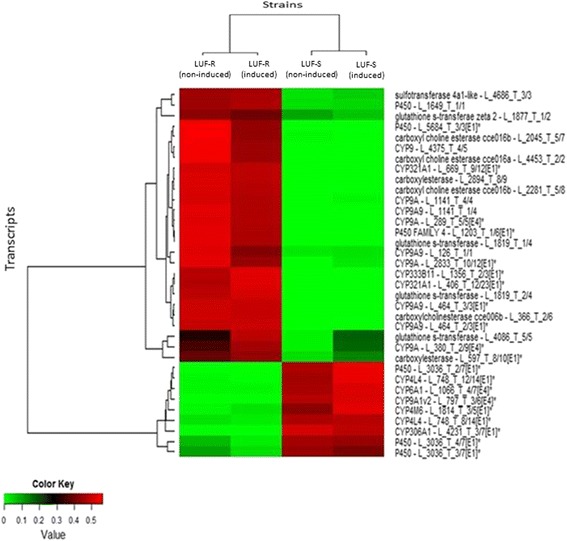
Comparative distribution of transcripts associated with detoxification enzymes of lufenuron-susceptible (LUF-S) and lufenuron-resistant (LUF-R) S. frugiperda strains that showed changes in the expression level. RPKM values were represented as a scale of colors ranging from green to red, which will encompass values from the lowest (green) to the highest (red) RPKM values. The title of each transcript consists of the identification of genes and code of the transcript. In P450’s transcribed capital letter and number is the class ID and group associated with gene superfamily