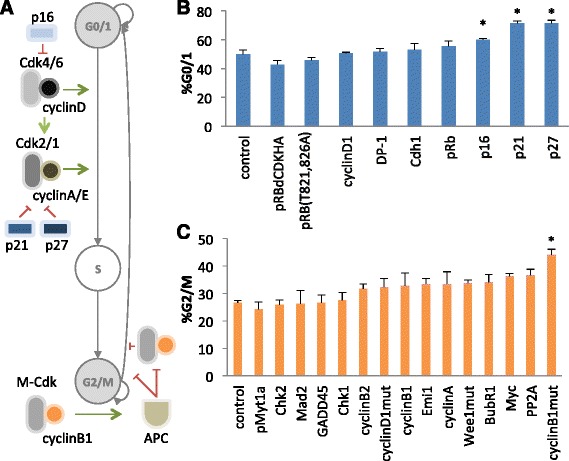
Fig. 1.

Screen to identify key regulatory nodes that produce cell cycle arrest in G0/1 and G2/M. a Schematic of the progression through the phases of cell cycle and a simplified representation of the identified key node function in cell cycle regulation. b, c Potential regulatory node proteins were overexpressed and the resulting cell populations were assayed for changes in the percentage of cells that were in G0/1 phase (b) or G2/M phase (c) relative to a negative control (i.e., control plasmid that does not alter cell cycle progression). *, p < 0.05. Cells were transiently co-transfected with 3–3.75 μg of the plasmids encoding the expression of these candidate proteins and 1.13–1.5 μg of a plasmid encoding a GFP reporter. Error bars represent standard deviation across biological triplicates
