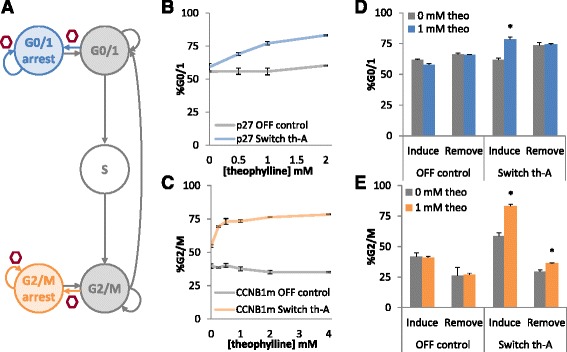
Fig. 4.

Small molecule responsive ribozyme switches for titratable and dynamic control over cell cycle. a Schematic of the progression through the phases of cell cycle (grey and white) with the introduction of the synthetic G0/1 cell cycle control system (blue) and synthetic G2/M cell cycle control system (orange). b Theophylline responsiveness of the G0/1 cell cycle control system (integrated p27-switch controller). Cell lines harboring the control system or a negative control were induced with a range of theophylline (theo) concentrations and assayed for the percentage of cells in G0/1 via DNA staining and flow cytometry. c Theophylline responsiveness of the G2/M cell cycle control system (integrated CCNB1m-switch controller). Cell lines harboring the control system or a negative control were induced with a range of theophylline (theo) concentrations and assayed for the percentage of cells in G2/M via DNA staining and flow cytometry. d The response of the G0/1 cell cycle control system to changes in theophylline concentration over time. Cell lines harboring the G0/1 control system (switch th-A) or a negative control (OFF control) were induced with 0 or 1 mM theophylline. After 3 days, samples were assayed for arrest in G0/1 by flow cytometry (induce) and re-seeded with 0 mM theophylline. After an additional 3 days, samples were assayed for G0/1 arrest (remove). e The response of the G2/M cell cycle control system to changes in theophylline concentration over time. Cell lines harboring the G2/M control system (switch th-A) or a negative control (OFF control) were induced with 0 or 1 mM theophylline. After 3 days, samples were assayed for arrest in G2/M by flow cytometry (induce) and re-seeded with 0 mM theophylline. After an additional 3 days, samples were assayed for G2/M arrest (remove). *, p < 0.05. Error bars represent standard deviation across triplicates
