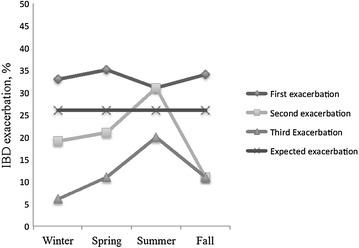
Fig. 5.

Seasonal distribution of the first three IBD exacerbations as compared to expected pattern of exacerbations expressed as percentage in a 3-D line graph. No difference was detected in seasonality between the observed and expected pattern of IBD exacerbations for the first three exacerbations experienced by patients (p values were 0.066, 0.250, and 0.17 respectively). IBD inflammatory bowel diseases
