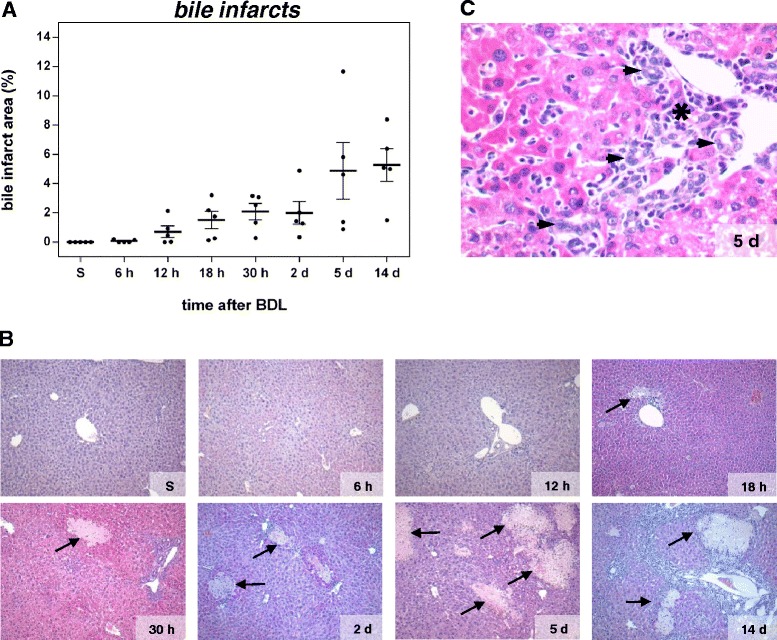
Fig. 2.

Quantification of bile infarcts in H&E stained liver sections at multiple time points after BDL (a). Values are given in means ± SEM of five independent experiments per time point. Representative H&E stainings of paraffin embedded liver sections for each time point after BDL (b; arrows indicate bile lakes; magnification x10) with higher magnifications (x40) in (c), displaying cellular infiltrates (asterisk) and formation of artificial bile ductules (arrowhead)
