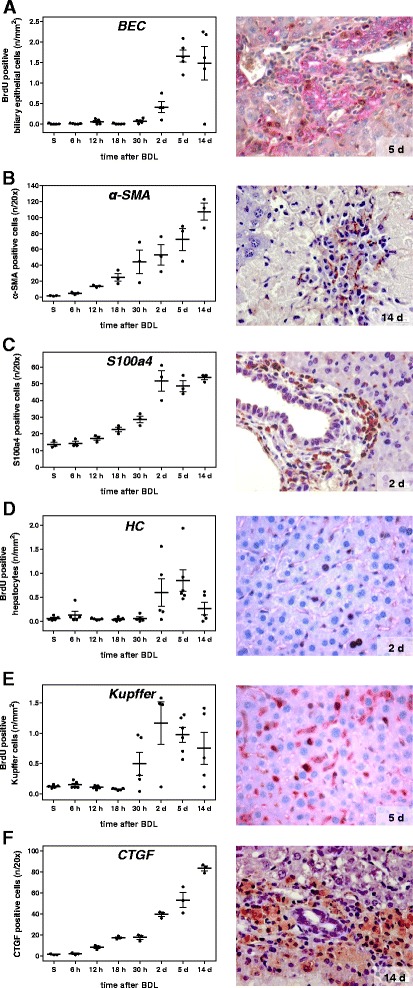
Fig. 3.

Analysis of the proliferative and cellular response at multiple time points after BDL. Quantitative immunohistochemical analysis of BrdU positive biliary epithelial cells (a), liver cells positive for α-SMA (b) and S100a4 (c), BrdU positive hepatocytes (d) and Kupffer cells (e) and CTGF positive cells (f). Values are given in means ± SEM of five independent experiments per time point. Corresponding representative immunohistochemical stainings are shown in the right panel (magnifications x40)
