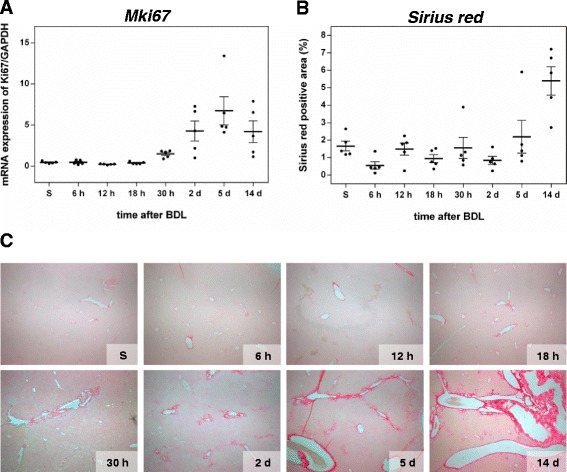
Fig. 4.

Analysis of proliferation and extracellular matrix accumulation. mRNA quantification of the proliferation marker Ki67 (a) by Fluidigm real-time PCR. Values are given in means ± SEM of five independent experiments per time point. Quantitative analysis of extracellular matrix deposition (b) and representative histological images (c; magnification x10) of Sirius red positive areas at multiple time points after BDL. Values are given in means ± SEM of five independent experiments per time point
