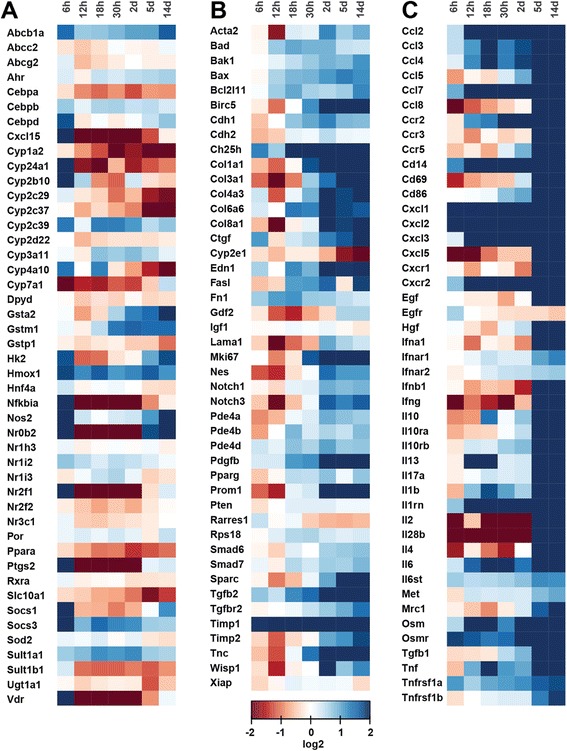
Fig. 5.

Heat maps displaying gene expression pattern at multiple time points after BDL. Gene expression relative to the Gapdh gene, obtained from Fluidigm qPCR, are shown as fold changes to sham operated mice (0 h) and are displayed in log2 scale. Red colour indicates down-regulation (log2 of 2), blue up-regulation (log2 of −2) and white transcription fold changes about 1 (log2 of 0). a selected ADME genes, (b) selected fibrogenesis genes, and (c) selected inflammation genes
