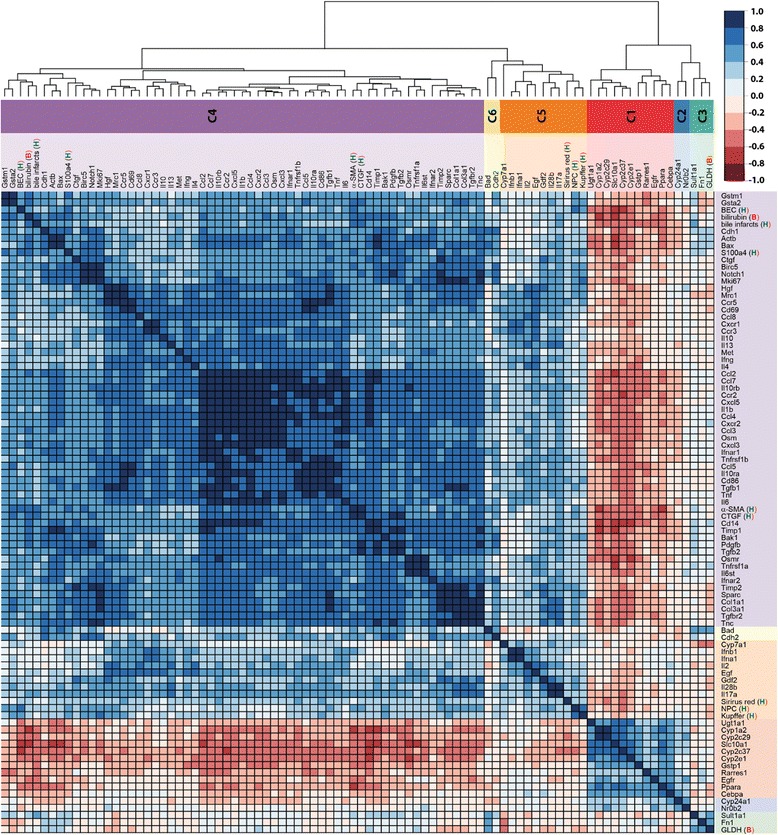
Fig. 7.

Correlation matrix of factors. Matrix of correlation coefficients between subset of factors, which changed significantly after BDL as determined by ANOVA. Correlation coefficients are YS3 correlations, with positive correlation depicted in blue, negative correlation in red, according to color key. Side dendrogram shows the results of hierarchical clustering with the resulting six time course clusters c1-c6 marked in the color sidebar (see Fig. 9 for time courses corresponding to the individual clusters). Histological factors are marked with H, immunostainings with A, and biochemical factors with B. The list of full names corresponding to the factor abbreviations is provided in Additional file 2, gene probes
