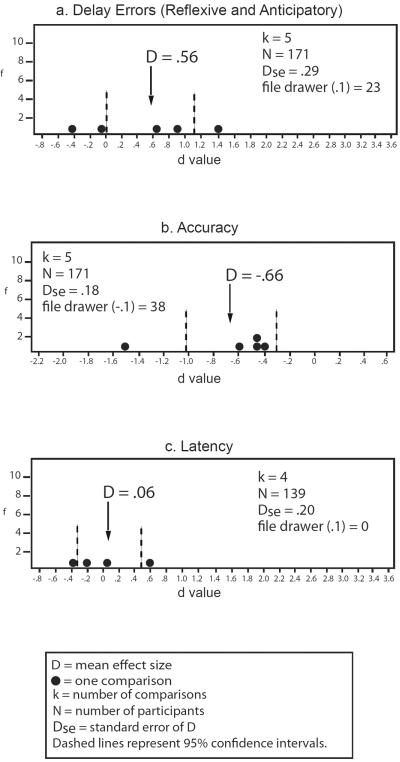
Figure 5.
Memory-guided saccade performance in relatives of schizophrenia patients v. non-psychiatric controls. Frequency distributions of individual study effect sizes for group comparisons, with mean D and 95% confidence intervals. f = frequency of effect size. File drawer = number of studies required to reverse the conclusions suggested by the meta-analysis, by reducing or increasing the estimate of the population effect size to either 0.1 or −0.1, depending on the predicted relationship, specified in parentheses for each analysis. A negative effect size indicates relatives had a lower mean than controls. Effect sizes are interpreted as: .2 = small, .5 = moderate, .8 = large.

