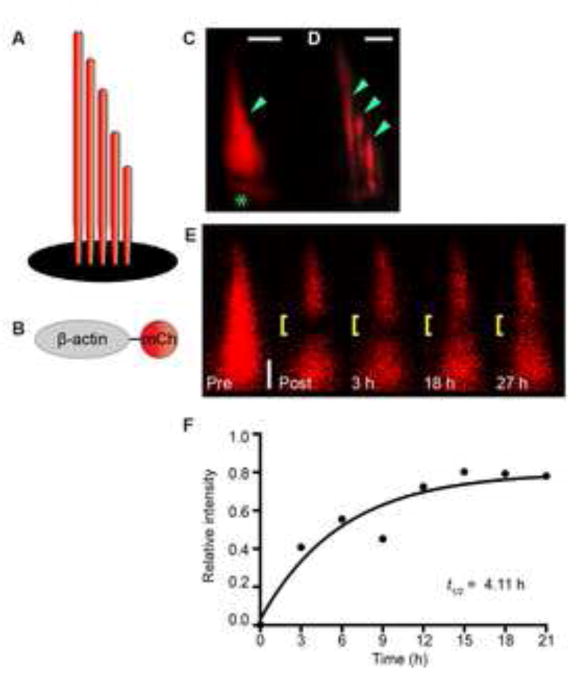
Figure 3. β-actin exchanges on an hourly timescale in live zebrafish hair cells.

Schematics of a hair bundle (A) and β-actin-mCherry (B). (C) Hair bundle (arrowhead) and cuticular plate (asterisk) labeled with β-actin-mCherry in transgenic zebrafish. (D) Confocal image of three stereocilia (arrowheads) from a splayed hair bundle reveals even labeling across each stereocilium. Splayed bundles are rare in this transgenic. Note: limited portions of each stereocilium are in the plane of focus. (E) Quantitative fluorescence recovery of a bundle containing β-actin-mCherry after a midsection bleach (yellow bracket). (F) Recovery plot reveals a t1/2 of 4.11 h for the hair bundle observed in E. The data points are fit to a one-phase exponential equation. Zebrafish examined at 7 dpf. Scale bar is 1 μm. See also Figure S4 and Table S1.
