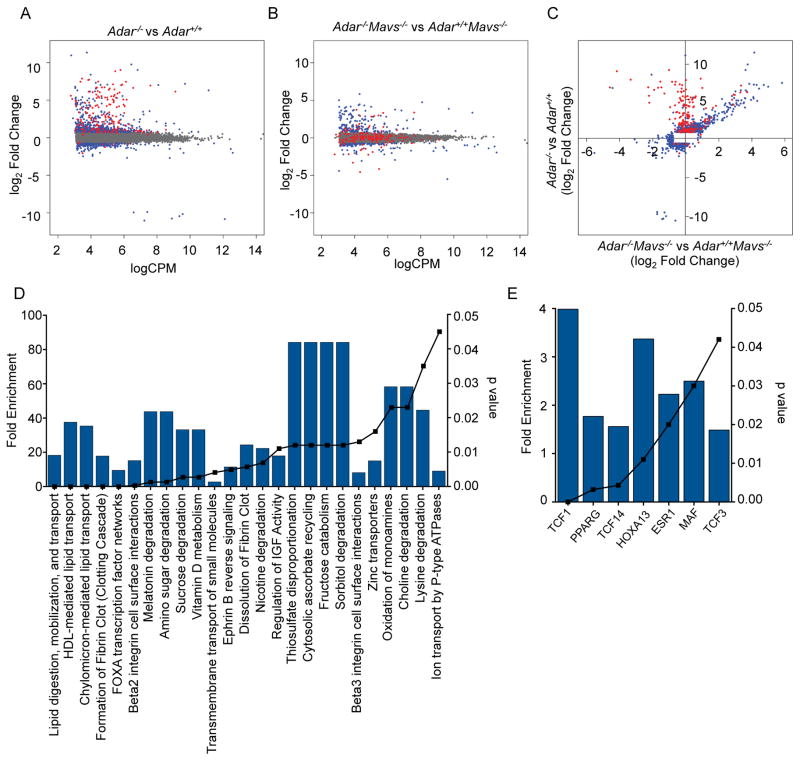
Figure 4. MAVS-dependent and MAVS-independent gene expression in Adar−/− embryos.
RNA-Seq was performed on rRNA-depleted RNA from whole E11.5 embryos of the indicated genotypes.
(A) Comparison of gene expression between Adar−/− (n=3) and Adar+/+ (n=3) embryos. Data are plotted as log2 fold change in gene expression on the y-axis, with normalized log2 counts per million (CPM) on the x-axis. Grey dots denote genes with insignificant differences in expression. Blue dots denote non-ISGs with differential expression (p≤0.01). Red dots indicate ISGs with differential expression (p≤0.01).
(B) Comparison of gene expression between Adar−/−Mavs−/− (n=3) and Mavs−/− (n=3) embryos, using the same criteria as in (A).
(C) Genes with differential expression (p≤0.01) in either pairwise comparison were plotted, with Adar−/− vs. Adar+/+ on the y-axis, and Adar−/−Mavs−/− vs. Mavs−/− on the x-axis. Blue and red genes are the same as (A) and (B).
(D) Biological pathways enriched among the genes with dysregulated expression in both Adar−/− embryos and Adar−/−Mavs−/−embryos identified in (C).
(E) Transcription factor binding sites enriched among the MAVS-independent differentially expressed genes from (C).
For D and E, fold enrichment relative to the representation of these pathways in the genome is shown on the left y-axis and the blue bars. Significance of enrichment is indicated by hyper geometric p-value on the right y-axis and the black symnbols/line. Analysis was performed using FunRich software.

