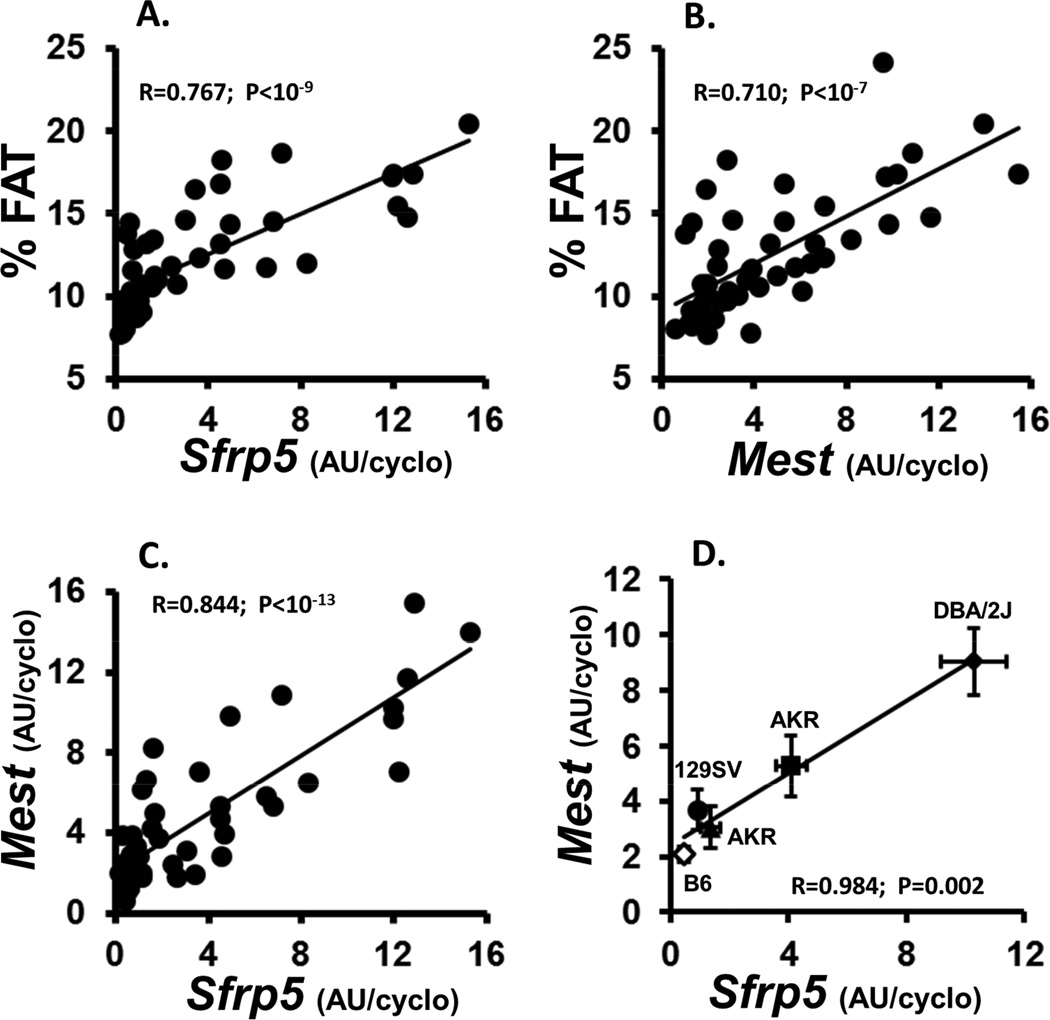
Figure 2.
Data represents the correlation between indices of adiposity (% FAT) with Sfrp5 (A) and Mest (B) gene expression; and, the correlation between Mest and Sfrp5 gene expression in all individuals from the 5 mouse strains (C) or by the mean ± SEM of each of the strains (D). Each strain represents the mean ± SEM of at least 9 mice. Body composition was measured via NMR. Gene expression measured by TaqMan QRT-PCR is represented as arbitrary units (AU) normalized to cyclophilin b.

