Figure 1.

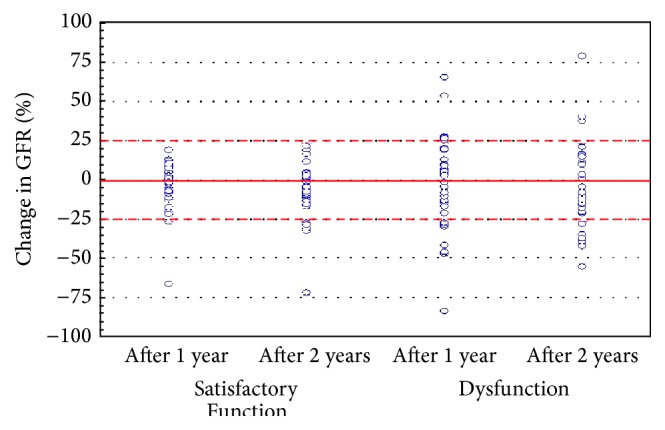
Scatterplot of patients from Satisfactory Function and Dysfunction subsets according to the change in glomerular filtration rate (GFR).

Scatterplot of patients from Satisfactory Function and Dysfunction subsets according to the change in glomerular filtration rate (GFR).