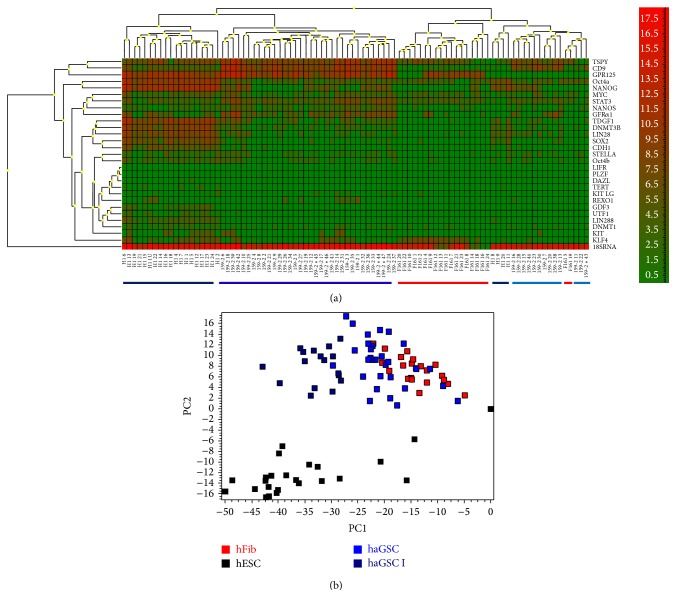
Figure 2.
Gene expression profiling of single hESCs, haGSC, and hFibs of germ cell-enriched and pluripotency associated genes. (a) Heat map showing array of pluripotency and germ cell associated genes with each column representing a single cell. Note that haGSCs (coloured blue) are a heterogenic population of cells with more similarities to hESCs (coloured black), while some outliner cluster with hFibs (coloured red). (b) PCA showing the distribution of single cells selected from the separated trees from (a). The group of haGSCs which cluster with hESCs in (a) are named haGSCs I and were coloured dark blue.

